What a CGM dashboard for clinicians should actually do
Raw glucose charts don't scale clinical care—pattern recognition does. A practitioner-first continuous glucose monitoring dashboard surfaces signal over noise, consolidates multi-patient views, and turns days of data review into minutes of clinical insight.

Continuous glucose monitoring generates an overwhelming volume of data. A single patient wearing a CGM for 28 days produces over 40,000 individual glucose readings. Multiply that across a panel of patients using CGMs as part of metabolic health programs, and you're looking at hundreds of thousands of data points each month.
Manufacturer CGM apps were designed for individual patients, not clinical teams. They show raw glucose traces, but they don't answer the questions clinicians need answered: Which patients need attention this week? What patterns are driving metabolic dysfunction? How is this patient's glucose response changing over time? A practitioner dashboard built for clinicians, not consumers, changes the unit of work from "reviewing charts" to "identifying signal."
What consumer CGM apps get wrong for clinicians
Most CGM manufacturer apps were built to help individual patients track their own glucose. When clinicians try to use these tools for patient panels, the limitations surface quickly:
- One patient at a time: No multi-patient roster view, so reviewing ten patients requires ten separate logins or exports.
- Charts without context: Glucose traces are displayed without the meals, sleep, or activity that explain the patterns.
- No hierarchy of urgency: All patients look equally important, so you can't quickly identify who needs intervention.
- Manual pattern recognition: The app shows you the data; you do the work of finding trends, outliers, and opportunities.
This isn't a failure of CGM technology—it's a mismatch between consumer tools and clinical workflows. Clinicians need dashboards that consolidate, prioritize, and surface insight across patient panels, not individual data viewers built for self-tracking.

Learn more about Levels Pro
Extend care beyond the exam room with Levels Pro, the metabolic health operating system that unifies CGM, labs, food logs, and lifestyle data into a single, clinician‑ready view. If you are ready to practice truly proactive, personalized, preventative medicine, partner with Levels and start building measurable cardiometabolic outcomes at scale. Click here to learn more about Levels for practitioners.
What a practitioner CGM dashboard should show
A clinician-ready continuous glucose monitoring dashboard starts with the assumption that your time is the constraint, not the data. That means the interface should:
1. Show your full patient roster in one view
- See all patients using CGMs in your practice, with sortable columns for time in range, variability, adherence, and last activity.
- Quickly identify who's improving, who's stable, and who needs attention before scheduled visits.
2. Surface patterns, not just charts
- Instead of raw glucose traces, show:
- Time in range and glycemic variability trends
- Spike frequency and size
- Overnight glucose stability
- Day-to-day consistency
- Flag notable changes: "Glucose variability improved 18% this week" or "Three large post-dinner spikes in the past five days."
3. Link glucose to behavior in one timeline
- Display meals, sleep, activity, and glucose on a unified timeline so you can see why patterns are happening, not just that they occurred.
- Click on a glucose spike and immediately see the meal that preceded it, including photos, macros, and the patient's notes.
4. Provide AI-generated summaries
- Before each visit, review a concise summary: "Sarah's glucose control improved this cycle. Time in range increased from 65% to 78%. Main driver: consistent protein at breakfast and post-dinner walks. Area to refine: late-night snacking still causing morning spikes."
- Spend session time on strategy and refinement, not data archaeology.
5. Enable between-visit monitoring
- Health coaches and support staff should be able to review dashboards mid-week, flag emerging patterns, and send low-lift guidance without waiting for the next appointment.
How Levels Pro functions as a practitioner dashboard
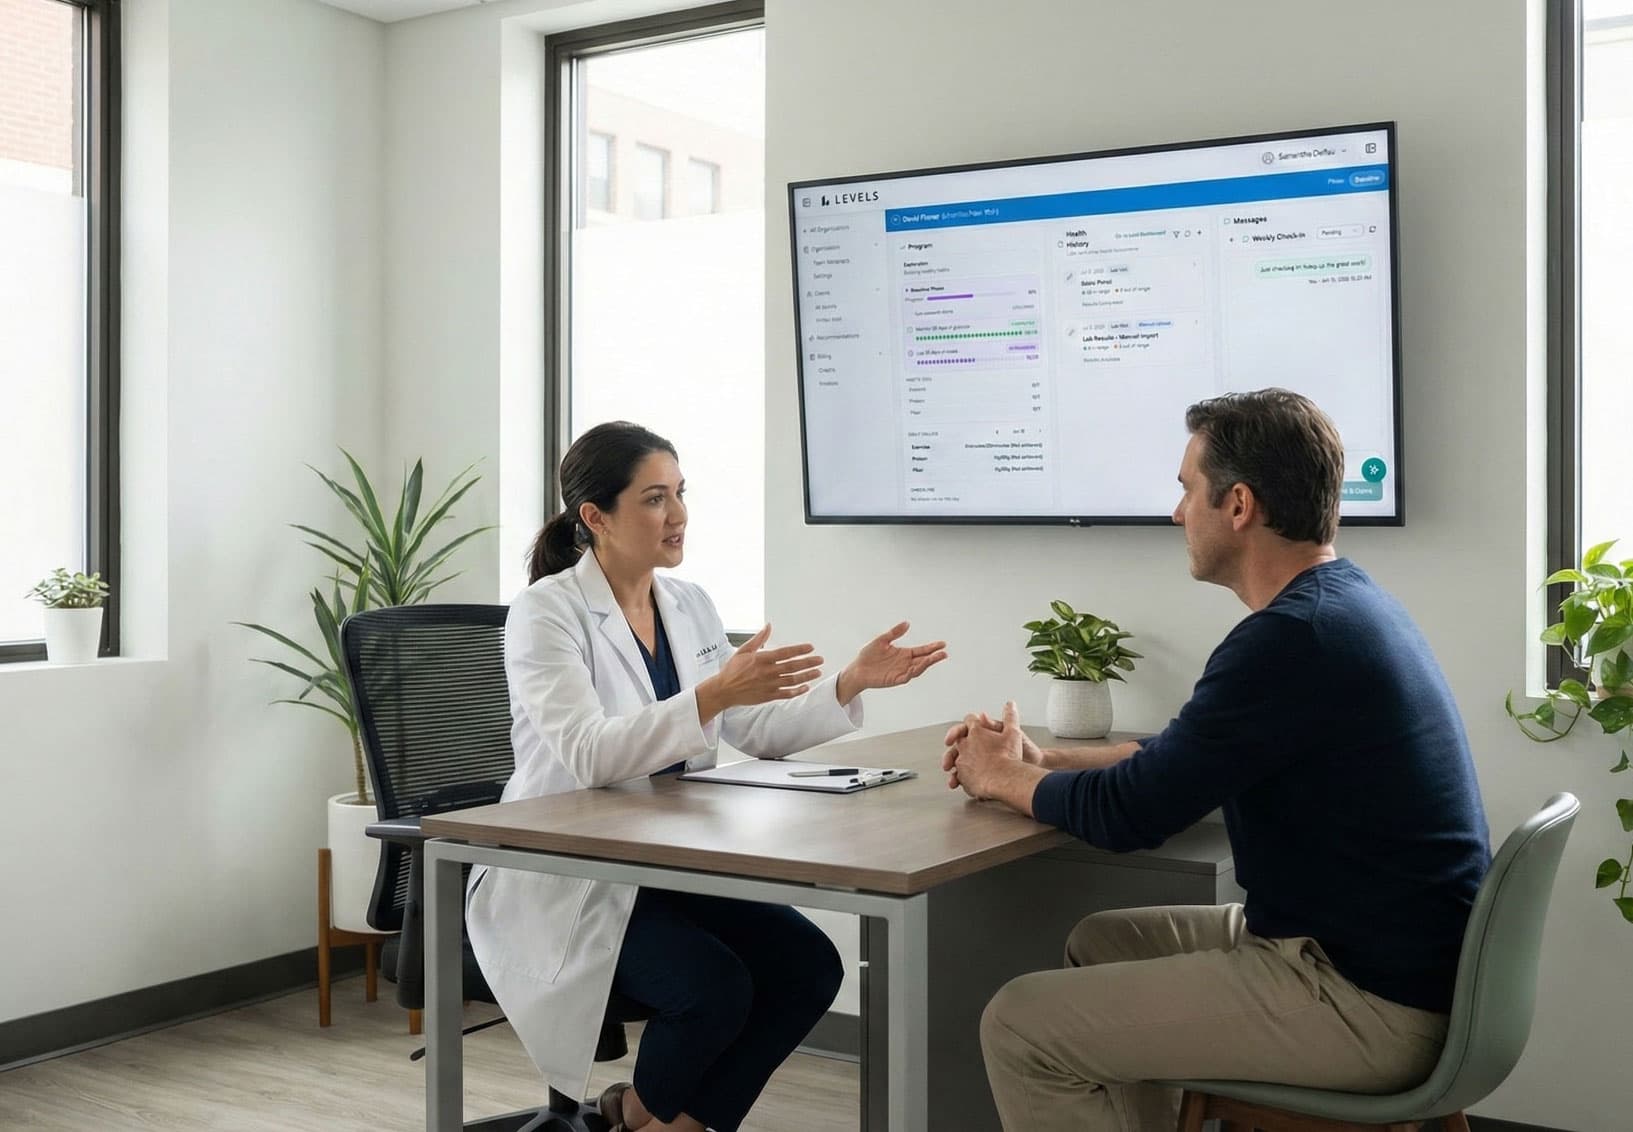
Levels Pro was built as a metabolic health operating system for functional medicine and integrative clinics. On the dashboard side, that means:
- Patient roster view: See all patients enrolled in CGM programs, with real-time metrics and engagement signals.
- Unified timelines: Continuous glucose monitoring data, food logs, sleep, and activity in one view—no flipping between apps or PDFs.
- AI-powered pattern detection: Summaries and trend flags surface before you open each patient's chart, reducing pre-visit prep from 30 minutes to 5.
- Multi-patient workflows: Assign tasks to coaches, track program milestones, and monitor adherence across your panel without manual spreadsheets.
Because Levels Pro consolidates CGM, labs, food, and lifestyle data in one system, clinicians spend sessions interpreting and guiding, not hunting for context.
What this enables: proactive care at scale
When your practitioner dashboard surfaces signal instead of overwhelming you with charts, clinical workflows shift:
- Faster pattern recognition: Spot trends in minutes that would take hours with raw data exports.
- Earlier intervention: Coaches review dashboards mid-week and guide patients before problems become entrenched.
- Scalable programs: Manage 20, 50, or 100 patients on CGM programs without proportionally scaling your review time.
- Better outcomes: When clinicians spend less time on data prep and more time on strategy, patients progress faster.
From data overload to clinical insight
Continuous glucose monitoring works. The question is whether your tools turn CGM data into clinical insight or clinical burden. A practitioner-first dashboard—one that consolidates multi-patient views, surfaces patterns over charts, and integrates glucose with meals and lifestyle—makes the difference between CGM as a gadget and CGM as a cornerstone of scalable metabolic health programs.
Levels Pro is built to be that dashboard: real-time continuous glucose monitoring, unified patient timelines, AI-generated summaries, and a metabolic health operating system designed for clinicians who want to extend care without extending hours.